NNOCCI Climate Science Fundamentals

In this blog, we talk about some of the basics of climate change. An understanding of climate science is the foundation of climate communication and action.
Weather Versus Climate
One of the most common misunderstandings when talking about climate change is the difference between weather and climate. Mark Twain commented: ‘Climate lasts all the time and weather only a few days’ (Le Row, 1887). Weather is what we experience on a given day: rain, sunshine, snow, etc. but it also encompasses temperature and humidity levels. This is what your local meteorologist predicts for you on the morning news. Climate, on the other hand, is the long-term pattern of weather; this is often taken over a 30-year average. The climate for an area is the typical pattern of precipitation, temperature, and winds as established over time, while the weather is the precipitation, temperature, and winds on a particular day. In other words, the climate is what determines what set of clothes you stock your closet with, while the weather is what you grab to be ready on a particular day.
The climate for a particular location is influenced by many factors. One is its latitude—how much sunlight does that area receive? Latitude also influences wind patterns, and winds are critical for transporting precipitation-bringing moisture around the globe. Other locational factors, like being near water or mountains, can influence how air flows in that place. Elevation and nearby vegetation also influence how moisture and heat flow in an area.
When we talk about climate change, we are talking about changes in this long-term pattern of temperature and precipitation. We can explain these long-term changes by thinking of our atmosphere as a heat-trapping blanket around Earth.
The atmosphere is like a blanket that surrounds the planet. It allows light from the sun to pass through to the earth. When this light is absorbed by the earth, some of it is radiated back out into space as heat while some of that heat is trapped by heat-trapping gases in the atmosphere. Carbon dioxide is one of these heat-trapping gases. When we burn fossil fuels like coal and natural gas for energy, we add to the blanket of carbon dioxide surrounding the planet. As more carbon dioxide is added to the blanket, it gets thicker and traps more heat.
This excess heat leads to warmer temperatures. But that isn’t the end of the story. Air can hold different amounts of moisture at different temperatures, so changing the air temperature also influences evaporation and precipitation rates.
In addition, because winds and water currents are driven by differences in temperature, adding more heat can also change where these winds and currents flow. In fact, the ocean acts like the climate’s heart, moving heat around the globe. When we change the amount of heat that is added, we disrupt the climate’s heart.
How Do We Know the Climate is Changing?
Scientists have known how carbon dioxide acts as a heat-trapping gas for over a century. Because of its shape, carbon dioxide doesn’t absorb much visible light but it absorbs heat very well; this means it very effectively lets sunlight in but traps heat from escaping. We also know from measuring the gases in the atmosphere that carbon dioxide levels have been increasing.
Starting in 1958, researchers at the Mauna Loa Observatory in Hawaii began collecting data on carbon dioxide in the atmosphere. The “Keeling Curve” shows long term change in atmospheric carbon dioxide (Fig. 1). There has been an increase in the mean level of carbon dioxide concentration from an annual average of 313 parts per million in 1958 to an annual average of 411 parts per million in 2019.
Where did this carbon dioxide come from? Regular levels of carbon dioxide are maintained by biological processes—respiration and photosynthesis. Humans and other animals breathe in oxygen and exhale carbon dioxide, while plants use carbon dioxide to build their stems and leaves, producing oxygen as a byproduct. Rampant levels of carbon dioxide are introduced by burning fossil fuels like coal, oil, and natural gas. When we burn these fuels, carbon dioxide is released in huge quantities but there is no balancing process to remove them. While dead-biomass does very slowly turn into fossil fuels, it occurs many thousands of times slower than the rate we are producing these rampant levels.

Figure 1. The Keeling curve shows carbon dioxide concentrations as recorded at Mauna Loa Observatory from 1958 to present. Notice yearly oscillations due to seasonally-based plant productivity. When the northern hemisphere experiences summer, plants take up more carbon dioxide during photosynthesis, compared with their contribution to carbon dioxide levels through respiration. When the northern hemisphere experiences fall and winter, levels begin to rise again as some plants slow growth and lose their leaves, decreasing their net carbon dioxide intake. Figure reprinted with permission from the Scripps CO2 program.
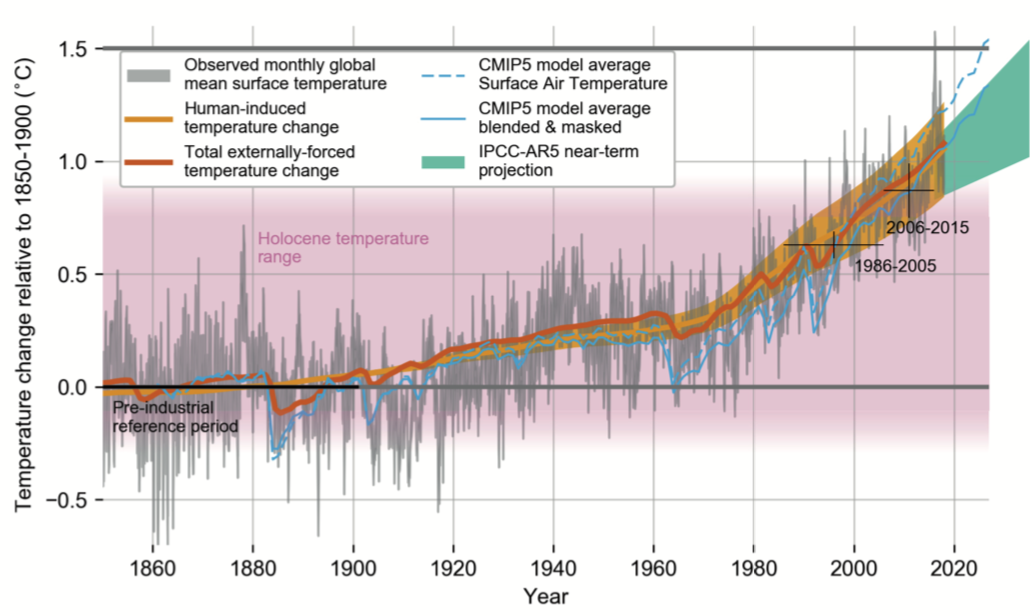
We also observe the climate directly to see that it is changing along with carbon dioxide concentrations. Around the world, researchers are collecting data to study climate. This includes taking measurements of global temperatures, ocean temperatures, sizes of ice sheets, glacier locations, snow cover, ocean pH levels, storm frequency and strength, sea levels, and levels of carbon dioxide in the atmosphere (Fig. 2). From these data, we know that the climate is changing, because we see sustained changes in these conditions over decades. Scientists are also working to understand the mechanisms by which climate changes. As we mentioned before, because currents and wind move heat around the world, and because vegetation and land-use also differ, the planet doesn’t change evenly across the whole surface. In addition, because plants and animals may react to changes in their environment by moving or growing slower or faster, additional cascading effects can be triggered. Characterizing the processes for how rampant carbon dioxide influences the climate helps us to understand and predict the changes we are seeing.

Figure 2. A figure reprinted from the 2018 IPCC Full Report showing observed temperatures over the last centuries. Also included are model averages based on surface air temperature and a near-term projection based on current emissions. For more information on externally-forced temperature changes, see Figure 3.
One way to do this is to look at the past climate. Paleoclimatologists, scientists who study past climates, have several sources for historical temperature trends. These include tree rings, coral rings, ice cores, fossils, and even sediments. Tree rings can help scientists learn about past climates in a local area. Tree rings are formed as a tree grows and the thickness of the ring tells a lot about the environment at the time it was formed. For example, in a year with a drought, the tree would likely only produce a very thin ring as it conserves energy rather than adding a lot of growth. Whereas a year with perfect conditions for the tree may result in a very thick ring as the tree grows very quickly. For more information on using tree rings to look at past climate, check out this article.
To look at past climates using ice cores, scientists drill deep into ice sheets on glaciers and at the poles. Once they have the cores, they look at the widths of the different rings as well as the composition of any materials that might be trapped within the ice. The ice cores will have layers from yearly snowfall. These layers are like a pile of papers on a desk – the most recent layer is on top and you can count back the years, layer by layer. In each of the yearly layers, there are deposits from the atmosphere including small bubbles of gas which was trapped when the snow fell. This bubble is a trapped snapshot of the atmosphere from the time the bubble formed. Scientists can extract those bubbles and measure the levels of carbon dioxide in the ice from each layer, allowing scientists to use ice cores like a time machine, going back 800,000 years. For more information on how to use ice cores to look at past climates, check out this article from NASA. Information from these various sources can be put together to give a picture of what the climate was like in the past. We can use these observations to know that temporary changes in past climates have been caused by volcanoes, solar variation, or even internal variability caused by events such as El Niño, but those changes have not been as persistent as the changes we see now.
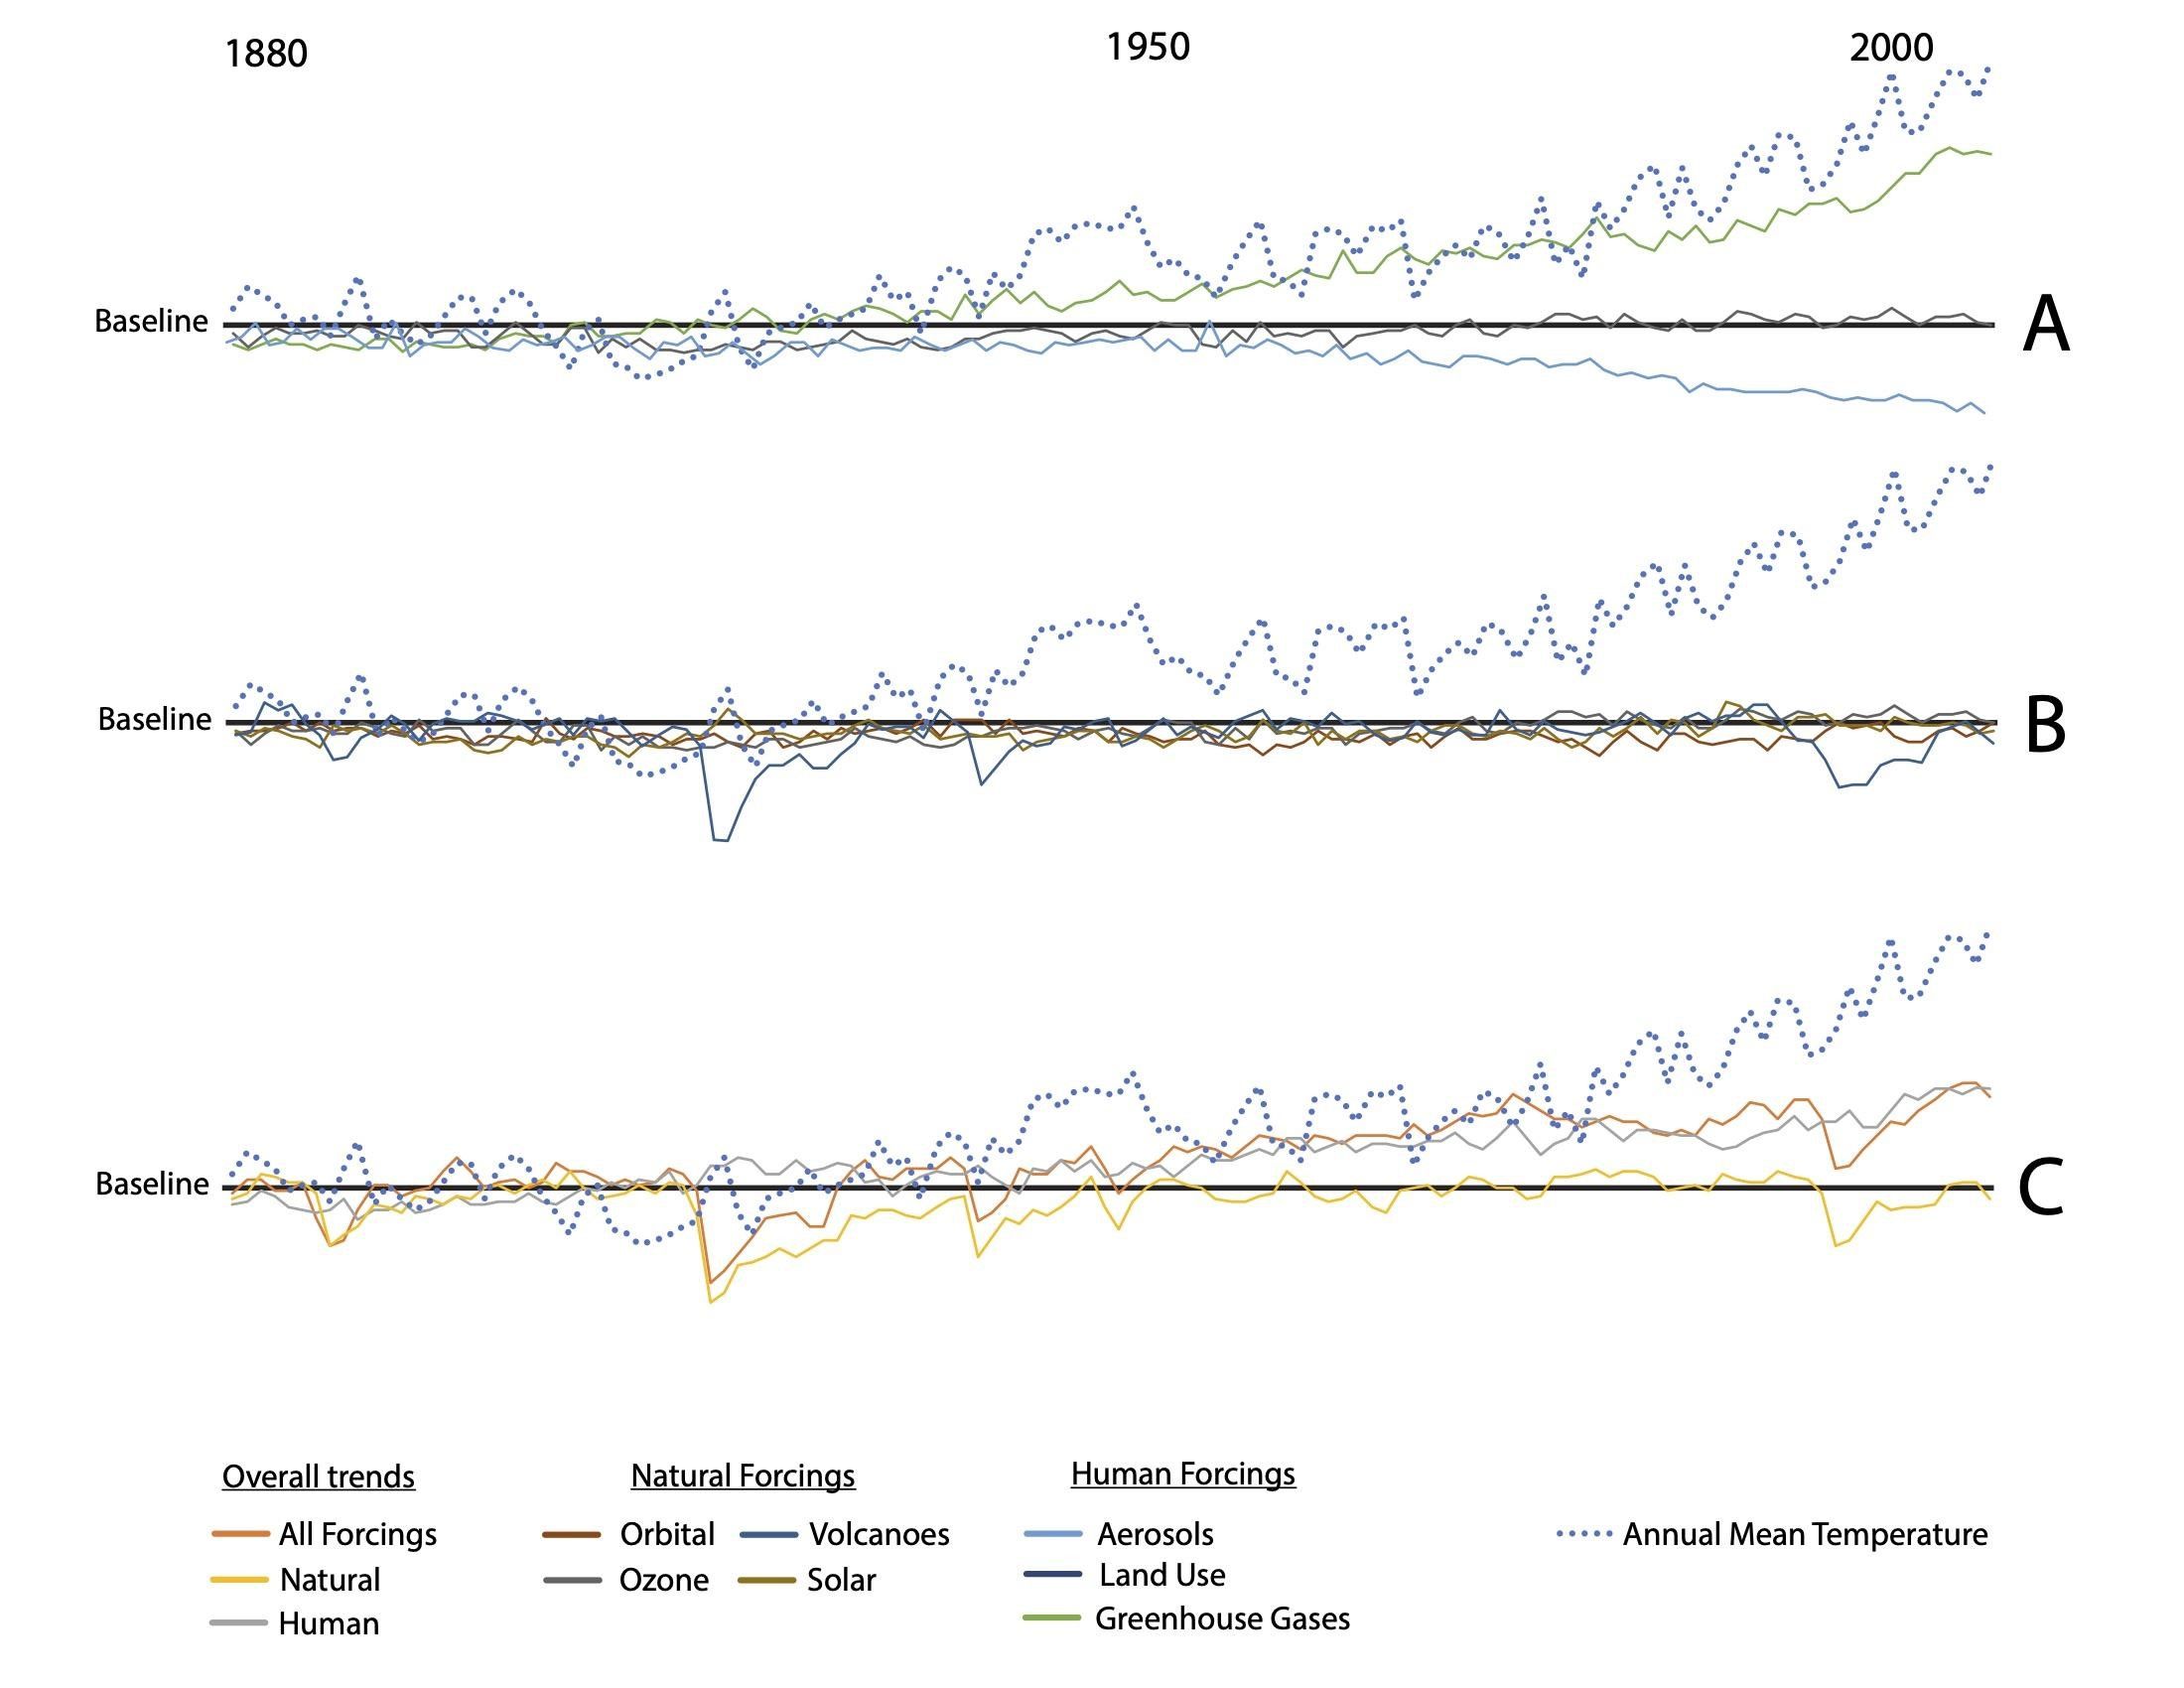
Scientists can also put these processes into computer models/algorithms to capture how these processes interact: the heat-trapping effect we talked about earlier, the way currents and winds work, the growth of vegetation, how the Earth’s orbit around the sun changes—all of these can be incorporated. We can then explore how much each of these processes is contributing to the climate changes we observe (see Fig. 3). This work has shown us that the natural processes are not sufficient to produce the changes we see; rather, the increased production of heat-trapping gases through human activity matches the rate at which climate change has taken place.

Figure 4. A special working group from the Potsdam Institute for Climate Impact Research prepared this figure from available data to demonstrate how certain future scenarios in our fossil fuel usage will contribute to radiative forcing over the upcoming years, which is directly related to warming. These “RCP”s, or Representative Concentration Pathways, represent the timing and severity with which we will combat greenhouse gas emissions globally. The red line, RCP8.5, is “business as usual”, in which we continue our current rate of global emissions. The blue line, RCP3-PD, represents our trajectory if we divested from fossil fuels immediately. As of the latest IPCC report, we are not only following, but exceeding the red RCP8.5 trajectory with our current emissions.
How Does Climate Influence Weather?
To learn more, see this Climate Interpreter blog about the Science of Extremes.
Unpredictability. As the climate changes, our ability to predict the weather will change as well. Having accurate weather predictions is important for daily life and disaster preparedness. As the climate changes, we will see impacts on the predictability and variability of weather patterns. Predicting hurricane intensity will also become much more difficult as the climate changes.
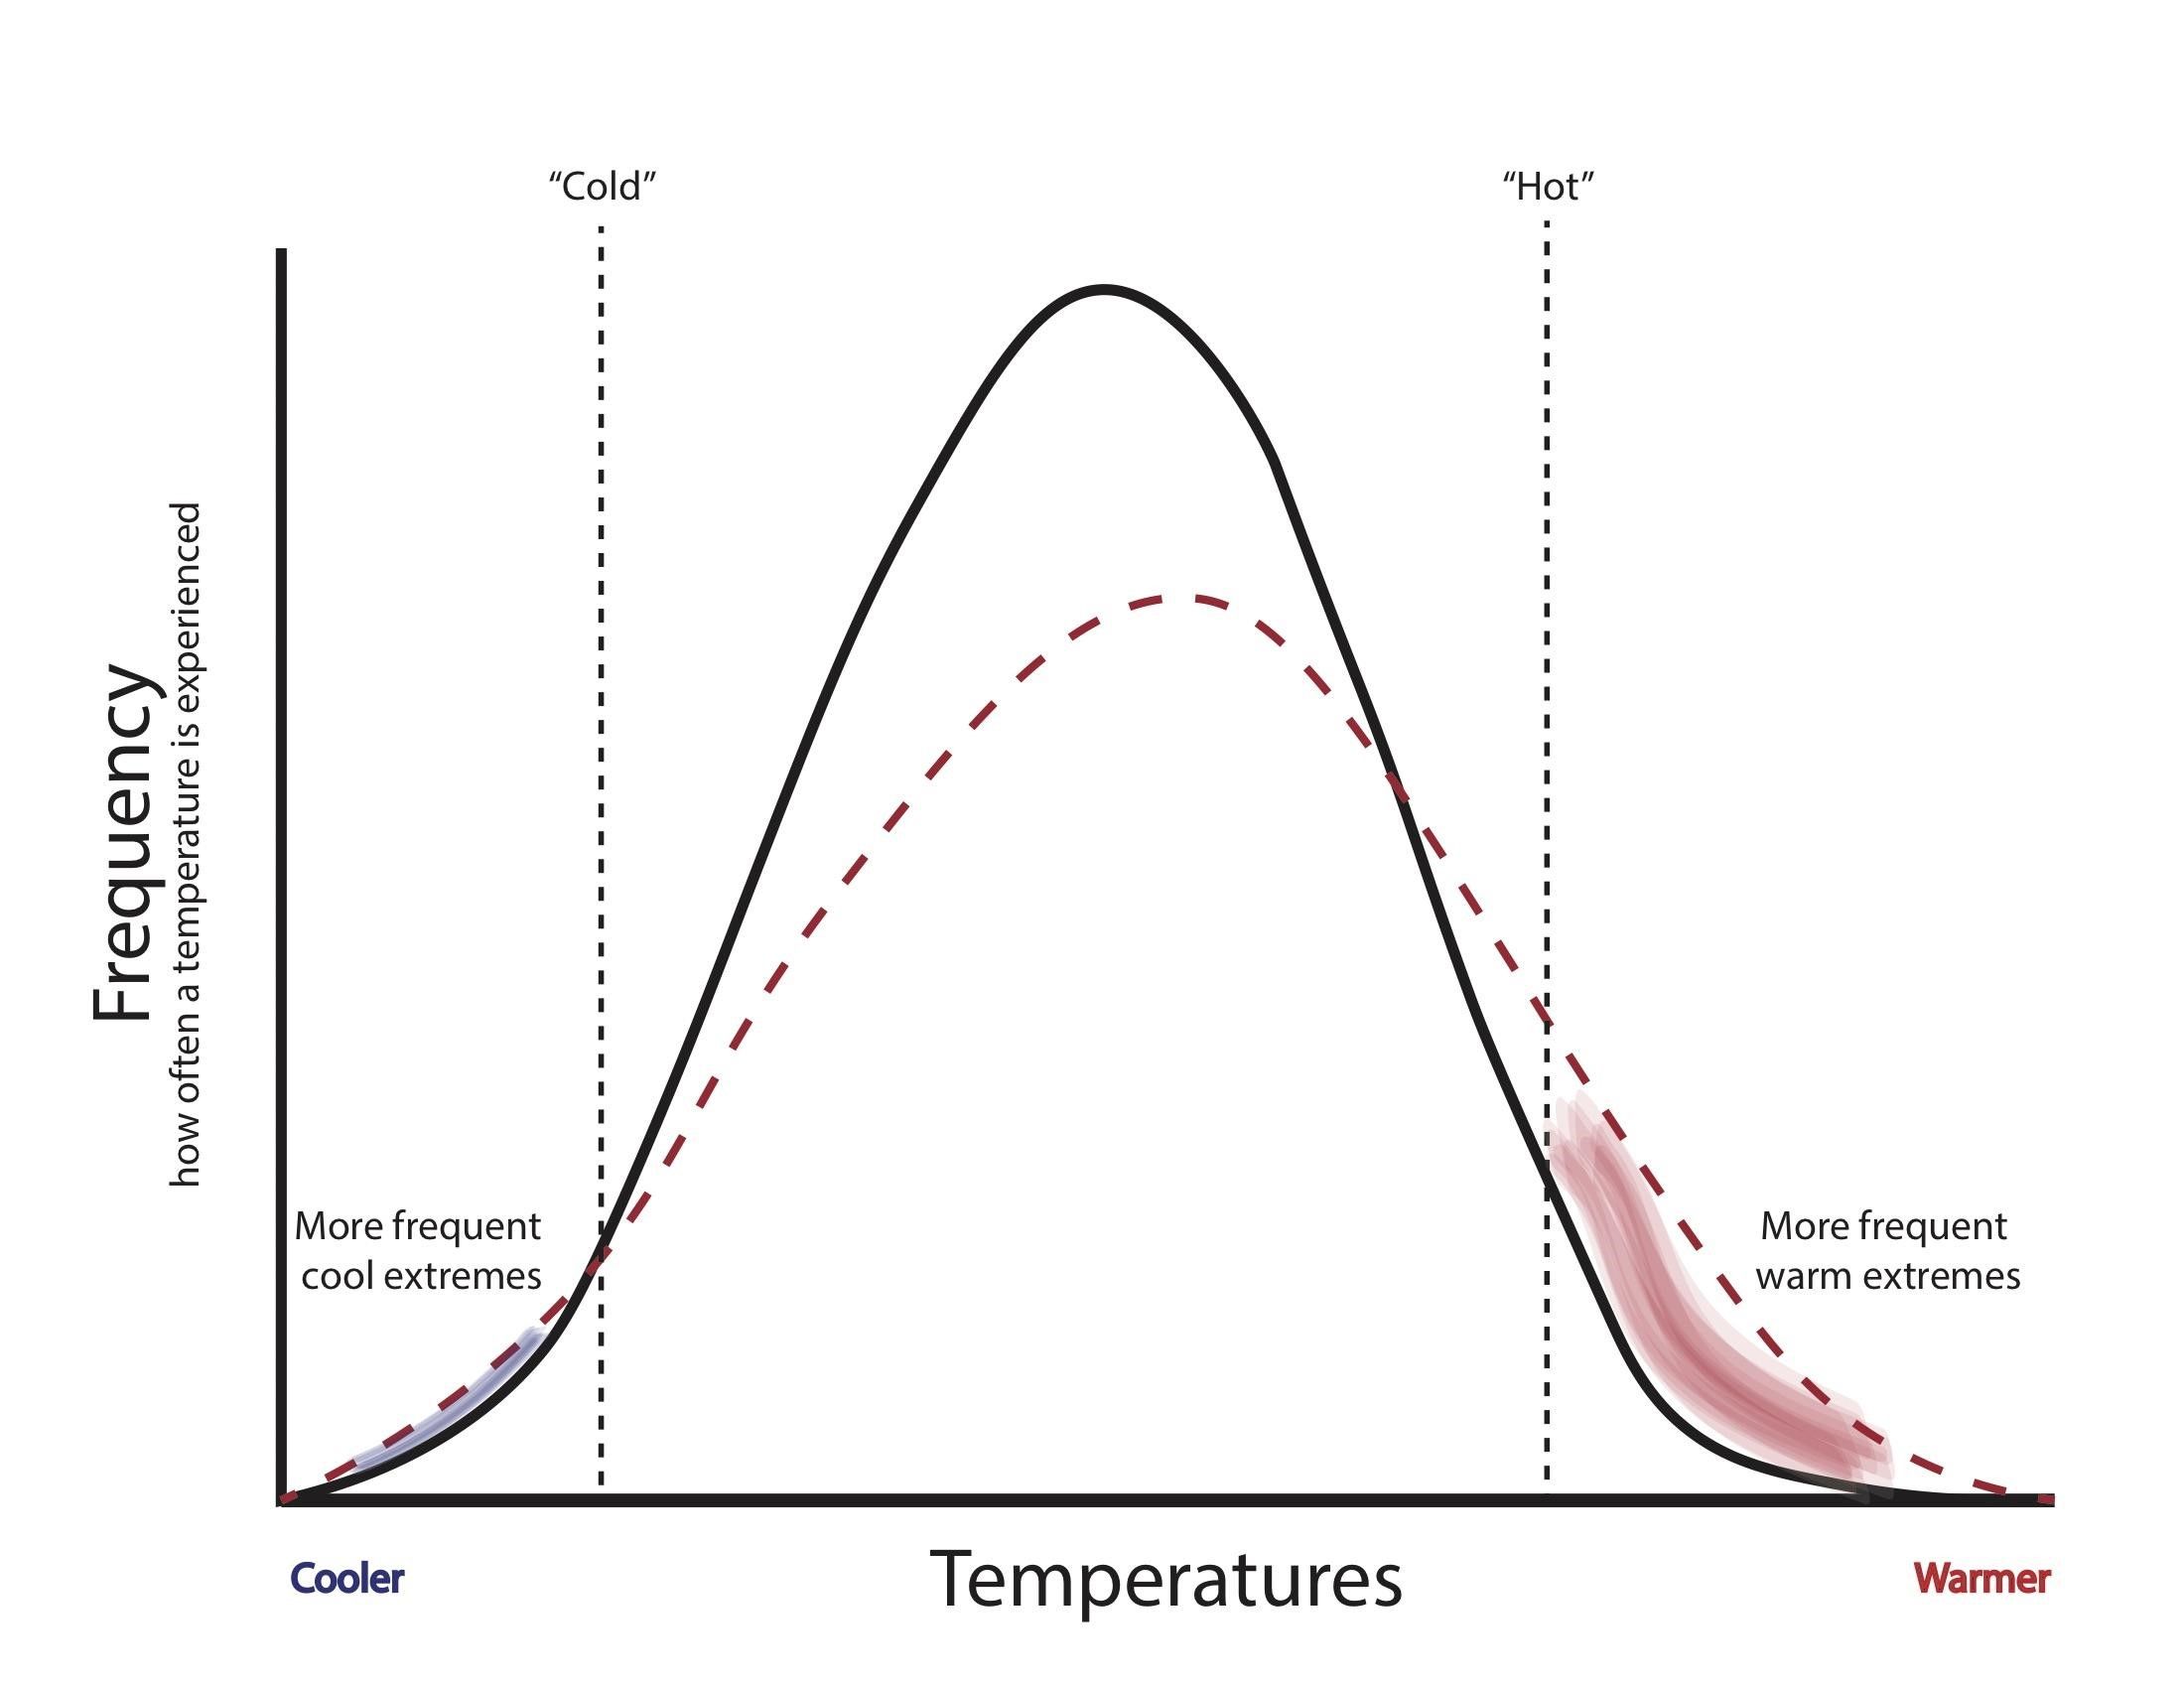
Climate change will likely lead to an increased number of hot days, droughts, and extreme precipitation. When modeling the expected changes in temperature related to climate change, the frequency of extreme temperatures in relation to average temperatures increases. This means that rather than having a traditional bell-shaped pattern, where the majority of temperatures fall within a narrow range, climate predictions show a much larger area under the right side of the curve (Fig. 5). This means there is a much greater likelihood of temperatures increasing much higher than the average expected warming predicted by models. As we see higher temperatures, we also expect to see more extreme weather, such as with an increase in the frequency and duration of heatwaves, droughts, and wildfire seasons.

Figure 5. In the present climate (black line), the majority of our temperatures fall within a narrow range of mild temperatures between cold and hot (relative to local climate). In a future climate (red dashed line), more of these temperatures will fall within the extreme zones, with a significant skew to the right of the graph – resulting in more extreme heat events. Figure by R. Tanner.
More extreme weather. Extreme events can include hurricanes, flooding, drought: they are short-term events that cannot be predicted with respect to their frequency over a long period of climate. With ongoing climate change, extreme events are expected to increase in frequency in some areas because climate variability is on the rise as our planet warms. With unpredictability comes sudden changes in regional climates, which can often lead to unexpected extreme events. For example, flooding can occur if winters are warmer than usual and large-scale climate patterns result in more frequent El Niño years (more influx of water on the US West Coast). Scientists are still trying to understand the direct links between extreme events and climate change, especially with respect to hurricanes, but there is evidence that a correlation between the two phenomena is linked to increased frequency of extreme events in recent years. Check out this cool graphic!
Do you want to know more about climate change and how to effectively communicate it to the public? Please check out these great resources from the National Network of Ocean and Climate Change Interpretation (NNOCCI):
- Training opportunities
- Changing the Conversation on Climate and Ocean Change online course
- Climate Change – Science, Impacts, and Solutions
- Framing Extreme Weather Events
About the authors: This summary report was prepared by the NNOCCI Governing Council as a collaboration between the Executive Committee, the Science Partnerships Committee, and the Training Committee for use as a teaching tool in NNOCCI training opportunities.
References
Keeling, C. D., Piper, S. C., Bacastow, R. B., Wahlen, M., Whorf, T. P., Heimann, M., & Meijer, H. A. (2001). Exchanges of atmospheric CO2 and 13CO2 with the terrestrial biosphere and oceans from 1978 to 2000. I. Global aspects.
Meinshausen, M., Smith, S. J., Calvin, K., Daniel, J. S., Kainuma, M. L. T., Lamarque, J. F., … & Thomson, A. G. J. M. V. (2011). The RCP greenhouse gas concentrations and their extensions from 1765 to 2300. Climatic change, 109(1-2), 213.
Zhai, P., Pörtner, H. O., Roberts, D., Skea, J., Shukla, P. R., Pirani, A., … & Connors, S. (2018). Global Warming of 1.5 OC: An IPCC Special Report on the Impacts of Global Warming of 1.5° C Above Pre-industrial Levels and Related Global Greenhouse Gas Emission Pathways, in the Context of Strengthening the Global Response to the Threat of Climate Change, Sustainable Development, and Efforts to Eradicate Poverty (p. 32). V. Masson-Delmotte (Ed.). Geneva, Switzerland: World Meteorological Organization.
More Blog Posts
 Connecting Higher Ed. And Public EducationConnecting Higher Ed. And Public Education by Richelle Tanner, May 09 2019 Public and higher education traditionally exist in separate spheres. And for good reason – there are different assumptions of prior knowledge, and different goals for informal educators vs. academic researchers. However, when it comes to highly-polarized, unfortunately [READ MORE]
 To Frame Climate Change, Lead with a Researched Value—Not a “Rogue” OneTo Frame Climate Change, Lead with a Researched Value—Not a “Rogue” One January 20 2017 This is the sixth post in a series about framing ocean and climate change. So, you want to motivate the public to take action to address climate and ocean change? One of the most important communications moves you can make is to open with a broad statement [READ MORE]
 The Science of ExtremesThe Science of Extremes by Richelle Tanner, July 13 2021 Extreme is a word that can send a climate communicator directly into the swamp: the word extreme is inherently a bit alarming, and vague enough to warrant a multi-sentence qualification when you use it. Even scientists disagree on what this word means and in which context it is appropriate. [READ MORE]
 Climate Emotions: Helpless Or Hopeful?Climate Emotions: Helpless Or Hopeful? by Heidi Zamzow, April 17 2019 With the recent IPCC warning that we may have perhaps a dozen years before we encounter severe and irreversible impacts of climate change, it comes as little surprise that a recent survey* in climate communications research indicates 7 in 10 people in the U.S. are concerned [READ MORE]
 Fresh ideas for talking about ocean acidificationFresh ideas for talking about ocean acidification by Richelle Tanner, July 30 2020 Our NNOCCI associate, Dr. Scott Doney, along with his colleagues, has recently published an updated review of the effects of ocean acidification on marine ecosystems (see here for a previous review). Read on for a summary of their main findings, and to understand [READ MORE]