The Science of Extremes
The Science of Extremes

Extreme is a word that can send a climate communicator directly into the swamp: the word extreme is inherently a bit alarming, and vague enough to warrant a multi-sentence qualification when you use it. Even scientists disagree on what this word means and in which context it is appropriate. The major issue with the word, “extreme”, is that it has too many uses, but little distinction between them. For the purpose of this explanation, I’ll speak in the context of global temperature as it relates to body temperature, since it is the most commonly discussed climate change topic. Keep in mind, these concepts related to the word extreme are fully applicable to other environmental factors like precipitation, salinity, dissolved oxygen, and ocean pH.
The first major distinction is between climatic and biological extremes.
-
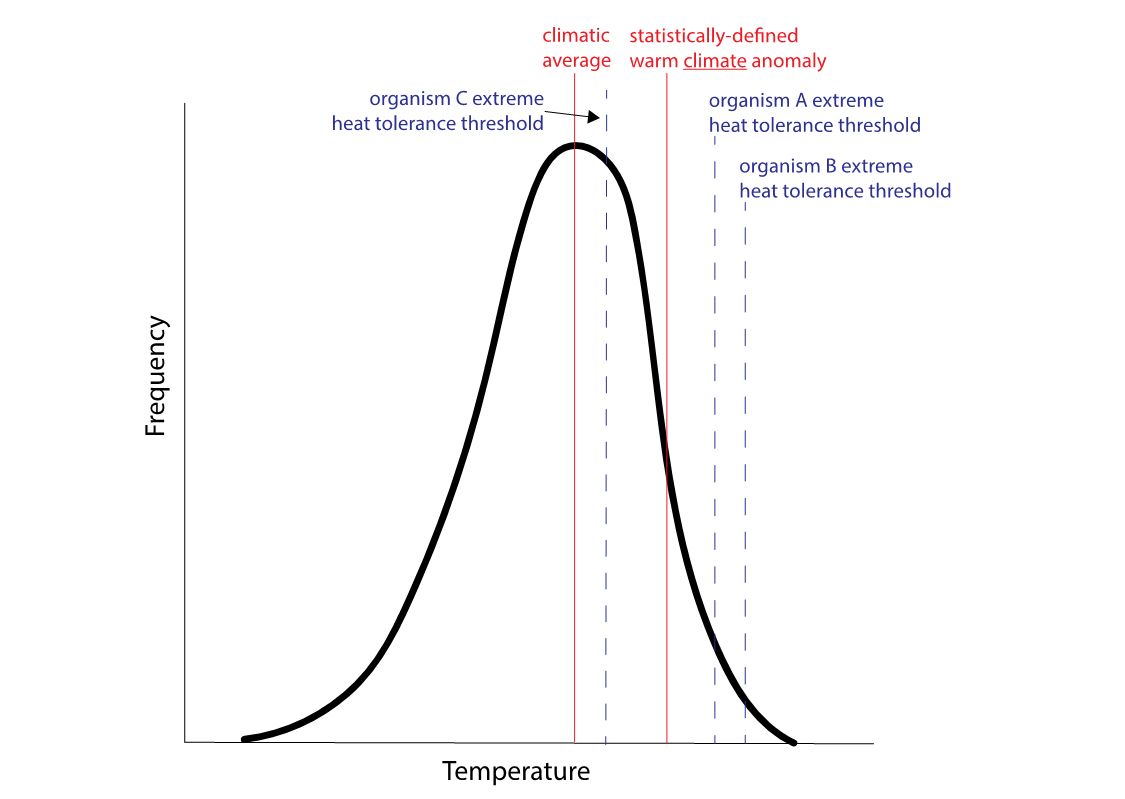
Climatic extremes mostly deal with some sort of statistical departure from the average temperature – something that is not within the normal window of temperatures usually experienced in a specific context.
-
Biological extremes refer to individual experiences above a certain performance threshold, such as optimal swimming speed, defined at a specific temperature. Performance thresholds usually have to do with a body function that is essential for an animal to survive for long periods of time.

Fig. 1: Climatic vs. biological extremes. (graph by R. Tanner)
The second major consideration is timescale: geologic, climatic (30+ years), seasonal, and daily. Timescales, or the relative windows of history we are considering, provide context to the mean temperature being used to define “extreme”. Biological extremes are primarily relevant at the seasonal and daily timescales, since only evolutionary processes operate at higher order timescales (e.g. geologic).
-
Geologic (thousands-millions of years): Average conditions spanning all of humankind’s existence may not be as extreme when compared with previous ice ages and warm periods.
-
Climatic (decades): Since the industrial revolution, the climate has been both warming and increasing unpredictable fluctuations in temperature from year to year. An extreme event in the last 10 years has a much different definition – in both size and likelihood – than an extreme event experienced by our great-grandparents.
-
Seasonal (months): Winter and summer have very different definitions of extreme, so this can be a confusing wrench in the conversation if we only consider above a certain temperature to be extreme. If you live in the northern US and experience a day of 80°F, this would not necessarily be extreme in the summer, but it definitely would be in the winter.
-
Daily: Night and day have different average temperatures.
There is no better visualization of this than the “Pumphandle 2016” YouTube video. In this video, we see a continuous graph of temperature throughout geologic time, using multiple sources of data (ice cores, weather stations, etc.). The consistent up and down movement of the graph shows the effects of seasons (more pronounced at higher latitudes), but notice that the average concentration of CO2 on the Y axis on the left graph increases over time, across all latitudes. Pay attention to the major swings in daily and seasonal temperatures reflected in the modern record, and to the pattern in the ~1970s-present graph on the right to think about climatic timescales. Around the 2:20 minute mark, we can see pre-industrial and then ice age conditions, or “before significant human contributions to atmospheric CO2”, to grasp geologic timescales. Keep in mind when viewing the geologic timescale represented in the video that our ability to see daily, or even monthly fluctuations in historical climate is not as easy as current measurements, and therefore we miss many documentations of historical “extreme” temperatures.
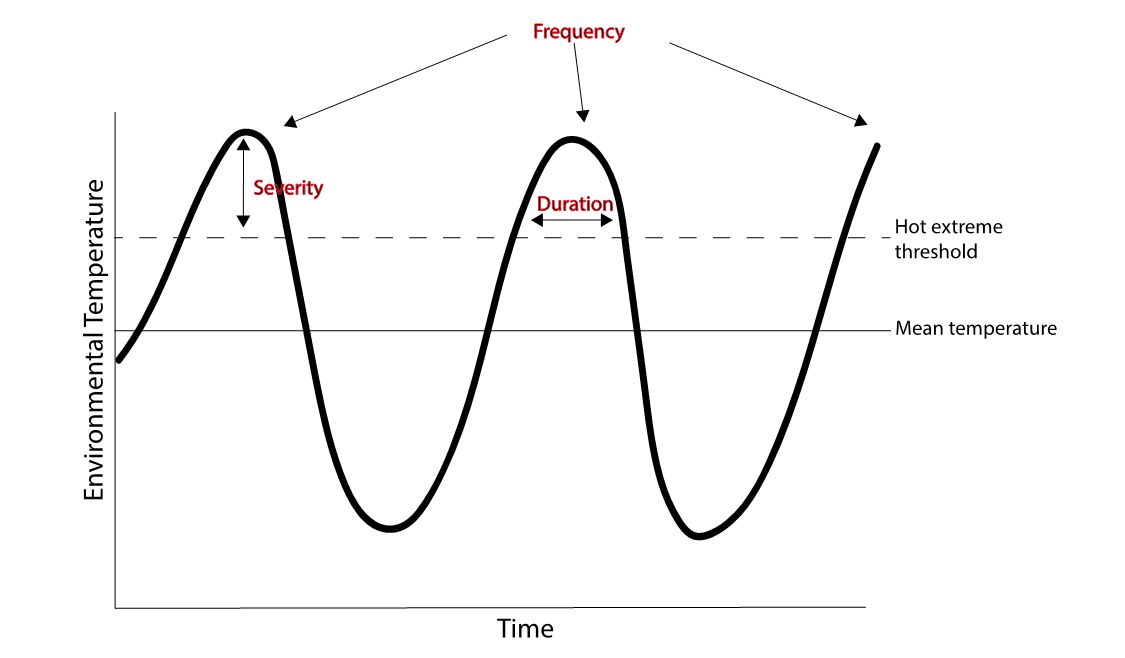
The final, most nuanced, distinction is the flavor of extreme. Extremes are defined by three things: severity, frequency, and duration.
-
Severity: the magnitude of “extreme”, or how far over a specific threshold an event is.
-
Frequency: the number of events that exceed a specific threshold within a certain time period.
-
Duration: the amount of time spent at some temperature above a specified “extreme” threshold.

Fig. 2: Extreme, as defined by severity, frequency, and duration. (graph by R. Tanner)
Any combination of the above definitions is currently, by scientists, labeled an extreme. There may be a seasonal period characterized by multiple, short high-severity heat events (i.e. an intertidal zone in the summer) or a multi-year period characterized by one long departure from historical mean temperatures (i.e. the “Great Pacific Warm Blob of 2013-2015”). These would both be considered climatic extremes. Animals living in these environments have their own definitions of extreme, based on how they interact with the environment and what their body’s limits are (when do they stop eating, moving, reproducing). For example, a snail and a fish living in a tide pool exposed to frequent climatic extremes may experience biological extremes at very different magnitudes depending on their evolutionary histories. This is why it is important to be clear in our understanding of the differences between biological and climatic extremes. An increase in climatic extremes may be driving SOME organisms to reduce the frequency (Fig. 2) of their biological extremes under a future climate through adaptation (see Fig. 1, blue lines). It is not a linear relationship, and not all organisms in the same habitat experience climatic extremes the same way.
This is a very important point for those of us looking to inject some hope into the extreme climate change story. Extremes are context-specific, and therefore so must be our solutions. The variation in types of extremes is large, and our action to address it must be as well. These extreme events may be unpredictable from a short-term perspective, but we can make long-term adaptive community decisions even beyond climate change mitigation (the most frequently referenced NNOCCI solution) to address tangible effects of often-devastating extreme events.
Additional primary literature readings:
Dowd, W. W., King, F. A. & Denny, M. W. Thermal variation, thermal extremes and the physiological performance of individuals. Journal of Experimental Biology 218, 1956–1967 (2015).
Kharin, V. V. et al. Risks from Climate Extremes Change Differently from 1.5°C to 2.0°C Depending on Rarity. Earth’s Future 6, 704–715 (2018).
National Academies of Sciences, E., and Medicine. Attribution of extreme weather events in the context of climate change. (National Academies Press, 2016).
Williams, C. M. et al. Biological Impacts of Thermal Extremes: Mechanisms and Costs of Functional Responses Matter. Integrative and Comparative Biology 56, 73–84 (2016).
About the Author:
Dr. Richelle Tanner is a Postdoctoral Research Associate at Washington State University, specializing in marine evolutionary and environmental physiology, climate change effects, and bioinformatics. She also serves as chair of the Science Partnerships Committee of the National Network for Ocean and Climate Change Interpretation.
This article was originally posted July 10, 2019. Given recent events, it seemed wise to re-post.
More Blog Posts
 Sea Slugs Make Climate Evolutionary ChoicesSea Slugs Make Climate Evolutionary Choices by Richelle Tanner, July 01 2019 Nudibranchs are a type of sea slug known for their beautiful colors and curious incorporation of other animals and plants into their own bodies (e.g. using plant chloroplasts to photosynthesize, incorporating toxins into their cells, and swallowing anemones’ stinging [READ MORE]
 Communicating in the Swamp: How to Navigate Public Thinking About Climate and Ocean ChangeCommunicating in the Swamp: How to Navigate Public Thinking About Climate and Ocean Change July 22 2016 This is the first in a series about framing ocean and climate change. When people think about oceans this summer, they might think of a good vacation spot—a place to spread out the beach towel, pop up the umbrella, and relax under the sun as [READ MORE]
 We Need a Sea Change in How We Communicate about Ocean Change. Metaphors Can Help.We Need a Sea Change in How We Communicate about Ocean Change. Metaphors Can Help. October 28 2016 This is the fourth post in a series about framing ocean and climate change. We depend on our oceans and must protect them, yet they are often overlooked in public conversations about “climate change.” As a result, most people don’t understand how [READ MORE]
 Museums Mobilizing Climate ActionMuseums Mobilizing Climate Action Billy Spitzer, August 06 2018 (Excerpted from a commencement speech for the Harvard Extention School Museum Studies Program) The Role of Museums In Tackling Climate Change At the New England Aquarium, I spend most of my time working at the intersection of museums and sustainability. About 10 years ago, we realized [READ MORE]
 My Community is My Hope #100HopefulDaysMy Community is My Hope #100HopefulDays Sarah-Mae Nelson, MS, CIG/CIT, February 03 2017 Today I turn 37 years old. This seems like an impossible number. In my mind, I am a vibrant 21-year-old eager to make the world a better place. I see opportunities to make a positive difference everywhere. I am young, I am empowered, and I am unstoppable. In [READ MORE]